For this diagram of self exercise I created a diagram relating my tracked hours in bed (in purple in background) and overlaid my tracked activity (in steps in the rainbow outlines in front).
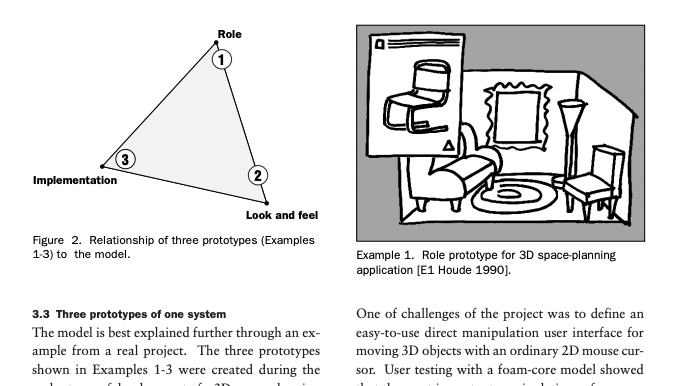
This was based off my readings and discoveries in the article on information architecture. In that article we read about the relationships between a 2 dimensional viewing medium, and how it can represent 3D relationships to the viewer, such as a 2D map can illustrate 3D distances and train stops, all while maintaining its basic 2D form.
The findings below is as mentioned, my steps per day over time overlaid on top of my time in bed over time. I started the sleep graph on 5 hours of sleep to identify a baseline to find a correlation. Otherwise, the 2 point maps will not overlay at all and thus would be more difficult to identify a correlation.
The correlation can be identified from this overlay and data below:
I get less hours of sleep in 2017-18, yet sleep and activity grew in July and October of that year.
In 2019-2020, My activity levels looked similar to to that of 2018, and my sleep time seemed to improe slightly as indicated by the slightly elevated sleep points.
In 2020 a more interesting correlation occurred. My time in bed increased closer to 8-9 hours, while my activity dropped significantly starting in April (Close to when the Coronavirus began)